Wednesday, September 7, 2011

Is it safe to come out from behind the sofa yet ?

Is it safe to come out from behind the sofa yet ?

Last week I took some short term and some longer term positions in the German Dax Index and individual German companies. The next day I felt quietly smug as the DAX Rallied a few percent outperforming the rest of Europe.

There is a saying that pride comes before a fall, well 'smug' comes before a really big fall.

At the close yesterday my recent German positions were as follows
ESX1 (DAX ETF) Down 9.4%
IFX (Infineon) Down 13.5%
UTI (Paris Listed European Utilities ETF including EOAN.F RWE.F ) Down 6.3%

Of the three positions IFX is the trade, I will be happy to hold onto ESX1 and UTI for the long term.

IFX is the stock ticker for Infineon a German manufacturer of chips and micro controllers. The company's chips are used in cars, industrial processes, payments cards and smart power applications. The stock is interesting because it provides leveraged exposure to the rest of the German industrial complex.

The costs for the German automakers BMW, Porsche, Daimler and Volkswagen to produce a car include -
  • Design
  • Tooling
  • Aluminium
  • Steel
  • Petrochemical based plastics
  • Rubber
  • Copper
  • Platinum for catalytic converters
  • Wood - sustainably sourced
  • Leather
Then there is
  •     Marketing the luxury lifestyle
  •     Sponsorship of motorsport teams and series
  •     The cost of dealership premises and staff
  •     The cost of transporting the finished cars to dealerships
  •     The labour to actually build the car

As the car manufacturers increase production so all of their costs tend to increase as they compete for the same resources however for a chip maker like Infineon the costs are largely constant regardless of volume. As every new car includes hundreds of microelectronic components Infineon is a direct beneficiary of the marketing, design, distribution and dealership network of the luxury car manufacturers without having to spend a single cent on any of these resources.

I have in the past held profitable positions in both BMW and Volkswagen, however in the longer run my concern is that these two companies are competing head to head for the same market segments. Its no coincidence that Audi has named its model series 4,6 and 8 in an attempt to get ahead of the BMW 3,5 and 7 series with which they compete. It doesn't seem such a far fetched scenario that the two automotive manufacturers will market harder, equip their cars with more technology and reduce profit margins in order to win market share, in this scenario there is only on winner - Infineon.

If it wasn't for the extreme volatility in the Infineon share price I would be considering the company as a long term way to play the German luxury auto industry without the resource, labour and competitive pressures facing the auto stocks. The stock is too wild for me to hold for any length of time, but for trading a rally in the DAX Infineon is about as good as it gets.

Getting back to the market, peeking out from behind the sofa I see that DAX Index has recovered 4%, the auto makers BMW, Volkswagen, Daimler and Porsche have all gained an impressive 6% but the winner by far with 8.59% is Infineon.

As my position in Infineon is still down 5% I will be looking for a few more days like today before cashing in and closing the position.
 
Long DAX, IFX and others, a bit sheepish and definitely not smug !

Trade update DIG

The oil price dropped suddenly on Thursday to a loss of around 4%. Whenever oil suffers a sudden drop I look to trade a bounce back. On Thursday I bought DIG at 41.59 happy in the knowledge that not only was there a 4% drop that was likely to bounce back, but also that US oil facilities were being shutdown ahead of several approaching storms.

The next day oil fell almost another 4%.

Normally I would have doubled into an oil trade at this point, but at the moment I have two much capital committed between the XIV, DIG and DAX Trades. I held the original position and have just closed it this evening for a profit of 207 USD after costs.

Oil continues to be a dependable trade, I look forward to closing the next level of the XIV trade in order to free the capital for future double down opportunities in oil. A double down on Friday would have netted closer to 800 dollars.

This trade provides an interesting demonstration of 'compounded loses'. Oil is now back to or even slightly above its closing price on Wednesday, however DIG is still a long way short of a full recovery. I have saved the 5 Day chart for DIG and will use it in a future page explaining compounded loses in the 'Why is it so difficult to make money trading' section. In the meantime I am happy enough with the 207 USD profit.

Monday, August 29, 2011

The Trader and The Fisherman

The Trader And The Fisherman
I have enjoyed fishing throughout my life, whatever town or city I have lived in I have always managed to find a place to fish. There is a saying among regular fishermen that '20% of the fishermen catch 80% of the fish', I consider myself firmly in the 20% that catch most of the fish.

There is no luck or magic to fishing, I often fish with my father and when we are fishing in salt water he will always without exception catch more fish than me. In freshwater its the other way around, I will always without fail catch more than my father even though we are sat in the same boat. The reason is simply that we have a different approach. In salt water my father baits up to target specific species based on the type of ground we are anchored over, the time of year, the depth of water, the strength of the tide and possibly a whole list of other factors that I have no knowledge of. In fresh water when we are fishing for trout, I have the upper hand, depending on the sunlight, clouds, wind direction, season, temperature and many other factors I am better able to predict what the trout will be feeding on at what depths and in which parts of the lake.

Insect Imitating Artificial Fly Used To Catch Trout

Before I come to the trader, the best example I can give of the 20/80 rule of successful fisherman is from a holiday I took in Mauritius.

Everyday, tourists and local people would fish the deep water around the rocky outcrops that surround the shallow bays where the islands hotels are built. In the two weeks that I was there I don't think I saw a fellow tourist or even a local fisherman catch a fish larger than a place mat.

An hour or two before sunset, one by one these fishers would carefully pack away their gear ready to try their luck again the next day.

Ten minutes later as the beaches cleared I would be assuring my wife of less than a week that this time I really would be back in time to take her for dinner.

As the sun set and the sky darkened, the shallow waters of the bay would sparkle with the reflection of the hotel lights. I wasn't the only one to appreciate the attraction of this light show, as I walked along the sand, the shallow water would boil with life as thousands upon thousands of small bait fish jumped for their lives to escape my advancing shadow. The water could boil away for hundreds of meters as the commotion spread from fish to fish along the entire length of the bay where the fish had come to shelter from the danger in the darkness, like flocks of birds roosting together for safety.

I would walk the shore looking for the shadow of a tree or a boathouse where I could hide my own shadow while I sat and waited.

As I waited I would scan across the bay searching for movement and most of all listening. Every night the quiet would be shattered by the storm of a million small fish fleeing for their lives. I couldn't believe that night after night I was the only person witnessing this. Every night, within 15 minutes of sunset a shoal of large kingfish would arrive having left their daytime open ocean habitat and entered the shallow water of the reef that surrounds Mauritius. For less than half an hour the kingfish would launch a series of explosive attacks on the shoals of bait fish corralled in the shallow bays. Outside of this magic half an hour spectacle, the kingfish could be anywhere in the wide open ocean far outside the reef that surrounds Mauritius, far outside the range and even the imaginations of the oblivious daytime fishers.

Giant Trevaly - One of many species of fish know as Kingfish and the only one I have caught

So what does this have to do with trading ?

As I sit and write this I have my trading account open in another screen and just like the ocean, just because the market is there, I don't have to be in it trying my luck. Its not about luck. With the knowledge and the patience of an experienced fisherman I must wait until the conditions are right before entering.

I won't fish with the crowd, the crowd knows the best spots, 'this must be the best spot because theres a crowd' says the crowd to itself.

I will be far from the crowd, in places the crowd doesn't want to be. But when the day comes and the crowd discovers my spot I will be happy to move on selling my catch as I go.

Oil at 87.50, too crowded.

Germany, the DAX index driven down nearly 25% in a mater of days and yet home to some of the worlds most recognisable companies - Porsche, Addidas, BMW, BASF, Allianz, Mercedes (Daimler), Bayer, Merk, Volkswagen, Siemens, Thysenkrupp and mobile phone chip maker Infineon.

That's my kind of spot.

Cautiously buying the DAX, sitting back in the shadows and waiting for the crowd to bite.


Sunday, August 28, 2011

Day Trading The FTSE

A common approach to day trading is 'scalping' in this approach the trader aims to trim a small profit off the top of the market each day. An advantage of this approach is that it doesn't require the trader to make long term judgements about the market direction. It also allows the trader to reduce the amount of time that capital is in the market and at risk.

This strategy provides an attractive balance between risk and returns although fees are a particular concern with this approach, see the page 'Why is it so Difficult to Make Money Trading' above.

To make the most of this strategy the trader would normally use leverage. Leverage comes in many forms but effectively multiplies the investment magnifying any profit or loss.

In the US Market there are a wide range of leveraged ETFs providing 2* and 3* Leverage however in the UK there are only two LUK2 and SUK2.

LUK2 is a leveraged long ETF which should increase or decrease in value by two times the daily increase or decrease of the FTSE 100 Index.

SUK2 is a leveraged short ETF which should increase or decrease in value by minus two times the daily increase or decrease of the FTSE 100 Index. This is what is commonly know as an 'inverse' ETF because it moves in the opposite direction to the underlying index.

5 Day chart of LUK2 and FTSE


The red line represents the FTSE 100 Index, the blue line represents LUK2. The chart clearly demonstrates leverage at work, for one and two percent moves in FTSE, LUK2 is moving two, three and four percent. There is however one major concern with this chart, there is very little volume in LUK2. The breaks between the shaded areas show periods where no trading has taken place. A priority concern in entering any investment is 'Who am I going to be able to sell this to ?' With SUK2 the low volume situation is even worse.

5 Day chart of SUK2 and FTSE


The concern here is that on Tuesday not a single trade was completed in SUK2. On this basis I would avoid LUK2 or SUK2 despite them providing exactly the sort of leverage I would be looking for. This might not be the end of the story though, volumes in both products have increase significantly over the past few months and they may one day become as actively traded as their American counterparts. A US based equivalent of SUK2, QID which tracks the US NASDAQ 100 index sees an average daily volume of nearly eight million shares.

In the meantime I will investigate whether there is a market maker actively trading these ETFs. A market maker is an organisation whose roll it is to provide liquidity in the market by committing to trade in selected stocks and funds. If there is an active market maker the low volumes could be less of a concern provided that the spreads are reasonable.

I am also investigating using individual stocks as a proxy for the whole market, in particular I am looking at banks, miners and asset managers. I will post my thoughts on this approach in the coming days.

Another area I am investigating is the efficiency in terms of fees, spreads and execution of using ETFs vs Covered Warrants vs Individual stocks for placing days trades on the FTSE.

Friday, August 26, 2011

Trade Update - DIG

While watching the German flash crash yesterday I wanted a quick way to make a profit on a bounce off the lows. I chose oil on the basis that there is global demand support for the oil price so if the flash crash turned out to be something more sustained I would at least have a position that would find some support.

To make this trade I chose the leveraged ETF DIG. I bought at 39.30 and sold today at 40.35 for a profit of 101 dollars after costs.

The oil price is towards the top end of the range it has trade within for the past two weeks. If the flash crash had happened while it was lower in the range I would have committed more money and held on for longer, as it is my reason for entering the trade has passed and I will have to be happy with the 101 dollar profit.

XIV Trade Update

The XIV trade was initiated as a way to play falling volatility. Volatility has been near 12 month highs and due to its calculation methodology has the property of tending to revert towards a mean value.

On the surface this is a high probability trade, however due to the structure of the XIV ETN its prone to roll decay when spot VIX is higher than near month and next month VIX futures.

Volatility has remained sufficiently high this week to keep the XIV trade out of the money and in the roll decay zone.

Last night I took the decision to take risk out this trade ahead of the Jackson Hole meeting by closing one of the position for a loss of 90 dollars including costs. The position was initiated on the 19th at 7.39 and closed on the 25th at 7.35. The trade had been in the money 300 or 400 dollars on several occasions during this period however XIV has shown a tendency this week to give back any gains very quickly.

Today I intended to use XIV or its opposite VXX to trade any sharp intraday movements resulting from Jackson Hole. As the minutes of the meeting were announced, the market dropped sharply taking XIV as low as 7.00, I waited for the market to stabilise and bought XIV at 7.09. A little over an hour later I sold XIV for 7.39 for a profit of 340 USD including costs.

5 day price chart for XIV Showing profitable spikes that are given back if not captured. Missed the first caught the last one.


I still have two positions in XIV, both are out of the money. I intend to leave these in play and may add additional positions to take advantage of future intraday opportunities.


Tuesday, August 23, 2011

XIV and Roll Decay

Understanding the performance of many ETFs and ETNs is like peeling onions, there can be layer after layer of complexity, often more than enough to make your eyes water.

The XIV ETN is a defining example of this complexity. Quoting from the prospectus, first we have the full product name -

'XIV: VelocityShares Daily Inverse VIX Short-Term ETN'


Then we have this sentence from the first paragraph which summarises the aim of the product -

'The return on the ETNs is linked to the inverse of the daily performance of the S&P 500 VIX Short-Term Futures™ Index ER less the investor fee'


So what exactly is XIV and how can it be expected to behave ?

The Exchange Traded Note (ETN) XIV is widely positioned in the media as a way to short the VIX Index. This is an incorrect positioning of XIV. The issuer uses deliberate language to outline the product, this language will have been carefully reviewed by the issuers legal department.

The summary makes reference to several key points -

1) 'Less the investor fee' - there is an annual fee built into this product which is 1.35%, this fee is applied daily according to a calculation also outlined in the prospectus.

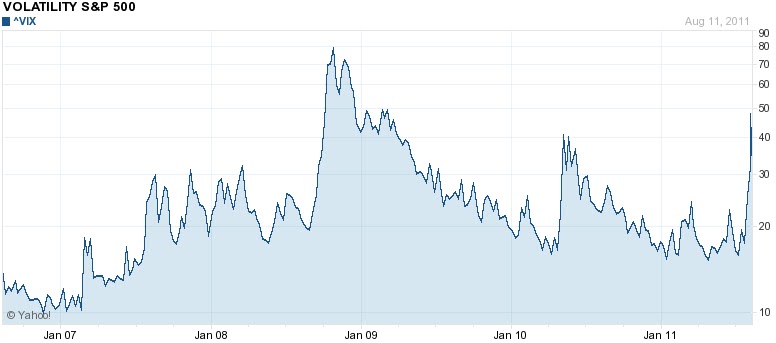
2) 'VIX' - VIX is an index, its basically a value calculated and published by Standard and Poors. It isn't something real, you can't buy a VIX.

3) 'VIX Short Term Futures' - While you can't buy a VIX as it isn't something physical, you can buy a futures contract for VIX. A futures contract is essentially an agreement between two parties that one will pay the other the difference between the value of VIX on a future date and the current value of the VIX. The party buying the contract will benefit if the value of VIX rises, the party selling the contract will benefit if VIX Falls.

4) 'Daily Performance' - this is a key piece of wording, all derivatives based ETFs and ETNs are now at pains to point out that they are 'Linked to Daily Returns' this is due to a wide range of factors which cause these products to significantly under perform over an extended period. Put simply most of them are mathematically guaranteed to lose money if held over an extended period. Hence the 'linked to' and 'daily performance'.

5) 'Inverse' - this means that the product is intended to return the opposite percentage of the 'VIX Short Term Futures' on a daily basis minus fees. While these points are common to many ETFs and similar wording will be found in many ETF prospectus, my interest is in the ability of XIV to provide short (inverse) exposure to the VIX index which is the context in which XIV is most often positioned.
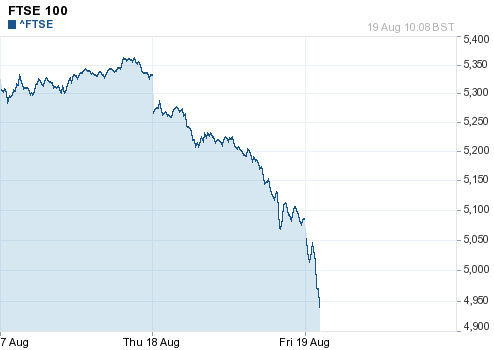
The following chart shows the price action in VIX over the past 5 days


I have marked a line on the chart to indicate that over the past 3 days, VIX held at a level which was 30% higher than it closed on August 17th. Within the highlighted period there have been intraday moves of -15% at the open on Friday 19th and -17% at the open on Monday 22nd.

If XIV represented a suitable product for gaining short exposure to VIX, we should have expected corresponding spikes in the value of XIV which could have been sold for a quick profit.

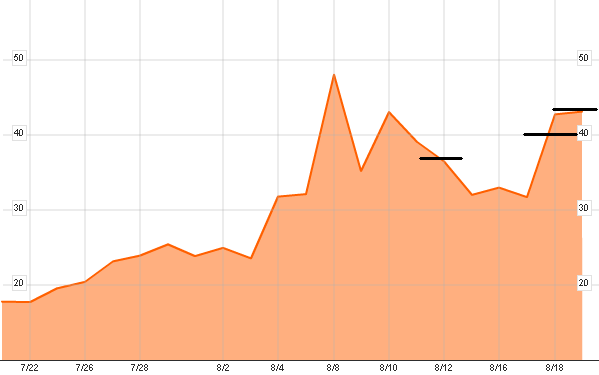
The XIV Summary explicitly states that XIV provides returns inverse the 'S&P 500 VIX Short-Term Futures™ Index ER'. This index is not the VIX index itself but a basket of futures contracts to buy the VIX over the present month and next month. The following chart shows the performance of SPVXSP the ticker symbol for the 'S&P 500 VIXShort-Term Futures™ Index ER' index.

There are three observations when comparing the two charts

1) SPVXSP - Does not jump 30% and then stay there but rather gaps an initial 15% and then continues to rise at a gradual rate through the next two days

2) The intraday spikes in SPVXSP are much smaller, around 5-10% against 15-18% in VIX

3) Although VIX appears to be fading on Monday 22nd closing around 8% down on the preceding close, SPVXSP continues to rise closing around 10% up on the Friday close. As a final observation at the present time, VIx is down intraday to a level only 20% above its close on August 17th, whereas SPVXSP is still more than 30% above its value on the 17th.

All of the observations are explained by the difference between the spot VIX index and the SPVXSP Index which is composed of a basket of futures contracts on the VIX Index. Futures contracts generally respond less than the immediate or 'spot' prices that they follow. The assumption is that whatever short term disturbances are impacting the market, these will pass in time so the future price of VIX tends to discount these effects.

This is enough to explain the smaller jumps in price, but there is another more powerful effect at work which is not immediately obvious from the charts, its also the most important factor from an investment perspective.

The steady upward path on the SPVXSP is in part due to 'roll'. The SPVXSP index is calculated based on rolling futures contracts forward, that means that everyday, a portion of the futures contracts which are nearest expiry are sold and the proceeds reinvested in contracts further out in the future. The rapid spike in the spot price of VIX this week has caused a market condition know as 'backwardation' where the spot price is higher than the futures prices.

As I type the VIX Prices are
SPOT38.2
VIX September34.95
VIX December32.10
VIX January30.47

This is a very positive condition for SPVXSP, when the contracts are rolled forwards, ie. sold at today's price 38.2 and reinvested in the next months contracts at 34.95, SPVXSP increases in size as its possible to buy more contracts using the proceeds of todays higher price to buy next months lower priced contracts.

While VIX remains elevated, the number of futures contracts that are purchase each day is elevated, and also the next month and later contracts will creep up in price towards the spot price. There is a dual effect of increasing the number of contracts held and an increasing value of the contracts held.

As good as this is for SPVXSP, it is equally bad for XIV which provides inverse performance to SPVXSP.

While backwardation often occurs in VIX Futures, it is an exception from the norm and generally passes quickly. Under normal circumstances where VIX Futures are a at a premium to spot, SPVXSP will suffer roll decay through selling expiring contracts at prices lower than the replacement contracts can be purchased leading to a daily reduction in the total number of contracts held within the fund.

For the past few days, my trades in XIV have been on the wrong side of this, steadily losing value as SPVXSP benefits from the temporary backwardation in VIX Futures.

Although VIX Has fallen over 10% today, spot VIX is still at a premium over current month and next month VIX Futures, this will provide some support to SPVXSP which is only down 3.3%.

For my positions in XIV to really pay off I would need spot VIX to fall below the current month and next month futures prices.

I will be selling my positions into the current risk on rally ahead of Fridays Jackson Hole meeting. I may then reenter the positions depending on the Jackson Hole outcome.

Sunday, August 21, 2011

Disclaimer

Disclaimer

This blog represents a personal journal of the authors evolving opinions. The authors opinion will change as new information, knowledge and conditions arise.

Under no circumstance should this blog be considered as providing investment, trading or financial advice, recommendations or instruction to act.

The author is not a finance professional.

Investment, trading and other financial activities as may be mentioned from time to time all without exception carry significant risk of loss. Under no circumstances should the content within this blog be considered as advice or instruction to invest, trade or refrain from investing or trading in any security or other financial product.


Before making any investment, trading or other financial decision, independent financial advice should be sought from a qualified finance professional licensed to offer advice in your jurisdiction.


At any point in time the author may have long or short positions in the securities mentioned, securities which provide equivalent exposure or securities which provide inverse exposure.

The securities mentioned within this blog include exposure to leverage through derivatives or other complex instruments. Leveraged products are subject to significantly higher risk of considerable financial loss. Always read and understand the full prospectus for any security before investing and again always see the advice of a qualified financial professional licensed to act in your jurisdiction.

The author cannot be held liable for any loss incurred.

Saturday, August 20, 2011

Trade Update - DIG and the Pit Bull

The DIG trade looked like being a winner, within minutes the paper profit was nudging 250 USD. I entered the trade looking for 350 or 400 USD so had no intention of selling at this point. Unfortunately that was the days high for DIG, through the next few hours, DIG traded between break even and a 150USD paper profit. I really should have sold at this point as my original reason for entry had passed. I held on to the position on the possibility of a late day rally, had this been any other day than a Friday I probably would have got my rally, instead most market participants were taking risk off by closing positions ahead of the weekend, this resulted in a steady drift lower into the close.

DIG Entry and Exit Levels


There is still an opportunity in oil, I will be looking to repeat this trade on Monday when I am not facing into the head wind of a weekend risk unwind, if anything Monday brings the possibility of a tail wind through new risk coming in.

Risk Unwind - Traders closing positions so that they have no exposure to the market over the weekend when markets are closed and there is no opportunity to cover open positions if the market moves against them.

New Risk Coming In - The market is open for trading, oil appears oversold, traders that have unwound risk into the weekend will be opening new positions i.e. adding risk, this should provide a lift to oil.

Looking back over the logic of this trade I am quietly kicking myself for not holding the position over the weekend. A good set up for the weekend would have been to close the position in DIG and reinvest the capital in USO. This would have reduced my risk by half and still allowed me to participate in any rally in the futures markets before the US Cash market opens.

And Now -
The Pit Bull Trade


So far so good. The rope is holding at a VIX of 43. I have three positions against VIX, one is a core position which I intend to hold for a month or more while VIX returns towards its long term mean value of around 20. The other two are short term trades. The plan is to take advantage of any short term blips in the VIX by buying successive positions in XIV (inverse VIX).

I have marked the approximate VIX levels I have positions against on the chart below.

The strategy for this trade is to add positions as VIX Spikes, as the spike fades so each position will come into the money.

Note: its important to acknowledge that under exceptional circumstances VIX Could double from its current level, therefore I will not be adding new capital (value at risk) unless VIX breaches 60 and  then 80. These are extreme levels which have previously collapsed very quickly leading to quick profits. It is only these extreme edge cases that would justify the addition of new capital to this current trade. In the short term I will be looking to reduce my value at risk by taking profits, preserving capital to take advantage of any new spikes.

Friday, August 19, 2011

How To Trade Oil - Is Dig Better Than USO ?

The short answer is no.

DIG is a leveraged ETF which attempts to return two times the daily return of oil. I have just taken a position in DIG at 38.75 and will be intending to exit this position in a few hours time. There are well documented issues with holding any of the leveraged ETFs over time, the chief problem is that the leverage compounds losses. There is also a built in value decay with any of the ETFs that are based on rolling derivative contracts. But to take advantage of a short term bounce DIG will do just fine.


I have marked my entry point on the chart, USO has 5% to go to get back to Wednesdays close, DIG has 10%. On the basis that we didn't all just park our cars and start walking to work, I will be taking my chances on DIG for the next few hours.


Heads You Lose, Tails You Lose.

The market has fallen steeply for two days, by around 9.30 this morning the FTSE was nearly 8% lower than the close on Wednesday, thats 8% in 10 hours of trading.

8% Fall From Wednesdays Close to 9:30 AM Friday


A rapid sell off such as this often presents the opportunity to take a quick profit by exploiting any intraday bounce off the morning lows. One way to gain from a bounce would be to use a leveraged product such as an option contract or a warrant to magnify the size of the bounce. Many warrants are available to retail investors offering leverage from 4 to over 20. Leverage essentially allows you to magnify small intraday movements so that a 1 percent bounce can lead to a 4, 5, 10, 20 % or more bounce in the leveraged product.

While examining the range of warrants available to make an intra day trade this morning, something interesting happened. The warrant RI29 which follows the FTSE 100 index of shares in London initially opened significantly lower, down from last nights 26p to a low of around 21p.

This looked like a good entry point to play any rally in the FTSE back above 5000, however while examining the full range of options to make this trade, the FTSE turned another leg lower. This action would be expected to drive the price of RI29 down even further.

It didn't. Against expectations, RI29 actually increased in value recovering from its 25% loss to trade back around 26p. Initially this does not appear to make sense, FTSE dropped further yet the contract which follows FTSE and should have dropped even lower actually gaped significantly higher. So what happened ?

RI29 is a call warrant, that means you are effectively buying the FTSE, when the FTSE rises the value of your call rises. Another type of warrant is a put warrant. A put allows you to sell the index, you might sell the index if you expect it to fall in value, if I sell it today (buy a put) and the index falls tomorrow, I profit by the difference, the profit comes in the form of an increase in the value of my put which at some point in the future will payout the difference between its strike price and the now lower FTSE.

RI41 is a put warrant, whenever the Ri29 call is rising in value this would suggest that the FTSE Index is rising in value and RI41 should be falling. This morning both RI29 and RI41 moved sharply higher together.
How can that be possible ? The index is either up, or down, it cant be both, can it ?

No, the FTSE index is just a value calculated from the current prices of a selection of shares traded in London. So how could two products that are designed to move in opposite directions, both move sharply in the same direction, was something broken ?

In a way yes, something was broken. For a short period this morning, it appeared as if the spirit of the market had broken, look at the chart at the start of the post, down 8% in ten hours, and which way is it heading still ? It looked as if the market might plummet again today and on this basis the measure of market volatility increased sharply.

Volatility is often termed the 'fear gauge' its a synthetic calculated value designed to provide an indication of how large market movements might be in the short term. When the FTSE Broke below 4950 to trade as low as 4938, fear took over and volatility exploded higher.

Options contracts and Warrants include volatility as a coefficient in their pricing calculations, in the brief period of outright fear, volatility increased from 29.59 to 34.31, this caused the price of RI29 to recover its initial lose of 25% and run all the way from a low of 21p up to 29 to now trade at a premium of 11%. This entire 36% (40% if you caught it at 21p) swing in price occurred even though the FTSE Was dropping and
could at first glance be expected to crash the value of RI29 as it initially did.

Sample Price Simulation For RI29, FTSE Lower, Volatility Higer, Value = 27p


So if the value of the warrants is increasing regardless of whether you take a position on the market rising or falling, surely its a one way bet, Heads I Win, Tails I Win ?

No, in fact its actually the opposite. The market is now rallying off the lows as predicted. You might expect RI29 to deliver a nice profit based on the rising FTSE however this is almost guaranteed to be a losing trade for the rest of the day. The problem is that a high volatility value is now included in the warrant price, as the market rises which is the action we would hope to profit from, the volatility component will fall back. This is guaranteed to limit our gains and could easily lead to significant loses even though we had correctly anticipated the market direction and positioned accordingly.

Sample Price Simulation For RI29, FTSE Higher, Volatility Lower, Price = 23p


End result, no trades today, Heads You Lose, Tails You Lose.

Note, to access the price simulations shown here, visit RBS Markets UK in the search at the top left of the screen enter RI29 or RI41. This will show the summary page for the given warrant, on the right you will see the basic price simulator, under this is an option to access the advanced simulator shown in the post.

Thursday, August 18, 2011

The Pit Bull Trade

The fear trade feels more like a pit bull trade today.

You know the scene, you have seen it in a thousand movies, its charging right at you, a great big rabid guard dog. The only hope you have is that the chain pulls tight before you get hit.

Thats how it feels to be stood in front of the VIX Index today, its charging ahead gathering speed, up 35% in eight hours of one way trade.

Last week the chain pulled tight at 48, in the crash of 2008 it ran all the way to 80.


Long XIV (inverse volatility) and praying for a short rope.

Wednesday, August 17, 2011

Trade Update - XIV

In a previous post I outlined how I intended to trade the dip in the market that I expected to result from the press conference at the end of the France, Germany european crisis meeting.

As expected the market dipped during the conference and then began to rise again, I wanted to trade this market movement and so took a position in XIV. See the previous post 'The Fear Trade' for some background on XIV and the advantages and risks of this product.

The following chart shows the price action for XIV over the past five days, the green line represents the S&P500 Index (one of the three main US Stock Indeces), the blue line represents XIV. While the S&P index has moved in a two percent range for the past few days, XIV has moved in a six percent range. My aim is to take a small profit every day by buying XIV near the bottom of the range and selling near the top.


I have added two lines to the chart to represent my entry and exit points. I entered the trade during the sharp dip lower at the end of the European press conference on Tuesday. I originally intended to exit the trade that evening, but set an exit price slightly too high leaving my position open through to today.

My entry price on Tuesday was 9.76, XIV Moved to 10.10 shortly after the open today giving me a paper profit of 340 USD ex costs. I expected the market to move higher from this point, and so did not close the position to realise the 340 gain. The market has since moved lower.

I will be exiting this trade this evening as my original reason for entry has passed. This is a key discipline, by closing the trade I am reducing my 'value at risk' should any unexpected events impact the market.

XIV has been as low as 9.56 (200 USD paper loss) and as high as 10.11 (350 USD paper profit) during todays session, I expect to exit slightly above my entry price of 9.76

Confirmation Bias and The Gold Bubble

I came across a classic illustration of 'Confirmation Bias' in an article about the gold price this evening.
Confirmation bias is not an arcane market indicator, but rather the simple observation that we all tend to place more trust in information which confirms our existing beliefs.

The example I have is a single article which confirms that gold is both the greatest investment opportunity and that gold is in a bubble. Its exactly the same article with the same information content which based on your initial bias is confirmation of one of two opposing conclusions.

You can read the article by following the link to Arabian Business at the end of the post, I have summarised the main information content below.

1) Dubai Gold Sales up 100%.
2) New types of customer are buying gold
3) We are going into the traditional gold buying season which should see additional demand
4) Dubai planning to launch a new gold coin to satisfy investor demand.

Now lets look at the bull and bear case for gold.

Bull - buy gold its the best investment opportunity.
Bear - avoid gold, its going up a bit more before it collapses, the upside is not enough to compensate for the risk.

1) Dubai Gold Sales up 100%.
Bull - Sales have doubled, gold is where its at, get some now !
Bear - Sales have doubled, sounds like gold is going exponential to me, generally its a sign of an imminent collapse.

2) New types of customers are buying gold
Bull - Yes of course they are, as everyone wakes up to the unique investment opportunity they are buying in and so am I.

Bear - New types of customers eh ? so people with no previous experience of the gold market are rushing in to buy gold, that has a history of ending well, I have some tulip bulbs they might also be interested in. (see references at the end if your wondering about the tulips)

3) We are going into the traditional gold buying season which should see additional demand

Bull - Yes, of  course it will, many nationalities buy gold at this time of year, festivals, marriage season, its all good for gold.

Bear - Ok, food has gone up in price, fuel has gone up in price. How much money is left to buy gold ? And isn't it possible that the high price of gold will drive people to buy less gold leading to a supply overhang ?

4) Dubai is planning a gold coin to meet investor demand.

Bull - Investor demand !!!

Bear - Exactly.

Its the same information, yet our in built confirmation bias prevents us from seeing any new information that would challenge our existing views, in fact our confirmation bias is so strong as to be able to bend information so that it provides additional support to our existing thesis.

I have made my case with regards to gold in a previous post here -

Should I Buy Gold

For the reference to Tulips see here - http://en.wikipedia.org/wiki/Tulip_mania
Link to original article - http://new.arabianbusiness.com/dubai-traders-report-100-rise-in-gold-bullion-sales-415755.html

Tuesday, August 16, 2011

Trade Update RI29 and XIV - FTSE CALL and Inverse Volatility


I have just closed my position in RI29, the trade has returned 18% after costs for a total of 649 Pounds. Not bad for four days - thats around 30 years worth of interest if the money was left in a checking account !
My reason for closing the trade is that I do not want to hold the position through the France/Germany meeting taking place oustside market hours this evening.

Twice in the past two weeks I have seen a European monetary offical and a US President talk 4% out of the market. I do not want to be on the wrong side of that with a leveraged position like RI29.
I may reopen a position in Ri29 tomorrow or take a counter position in New York this evening. My guess right now is that the European meeting will drive more money out of the market which is why I am out of RI29 for tonight. If Europe somehow comes out with a positive suprise I will be happy to open a larger position in RI29 in the morning.

I will also be watching XIV, I still have some money in this position, if the news tonight is good a lot of fear will come out of the market and XIV should move strongly higher. If the news is bad, XIV will take a major hit in which case I will double down as VIX has the unique property of always reverting to mean. See my post on the 'Fear Trade' for the reasoning behind doubling down on XIV if it dips.

See links to the right for product information on RI29 and XIV.

See links to previous articles or use the search option to find previous posts relating to the RI29 and XIV trades.

Monday, August 15, 2011

Trade updates USO, XIV, Oil and Volatility

In the last few minutes of trade today I closed my position in USO and closed half of my position in XIV.

The USO Trade has returned 435 dollars after costs. It doesn't feel like a great trade, I normally would have used a leveraged product, DIG might have returned double this amount and RH22 could have returned four times as much. However its still more than a years worth of interest on a savings account, or enough to fill my car with petrol for the next 13 weeks.

If I wasn't overweight the oil industry in my long term portfolio I would have held this position for a few more days, it does look as if there is more profit in it.

I will not use USO to trade oil again for the reasons outlined in the link below.

How To Trade Oil USO

The XIV Trade has returned 470 dollars after costs.

The Fear Trade - XIV


I have kept half of the position open with the intention of buying the dip if there is some negative news out of the Europe meetings tomorrow. This product has its problems, as per previous posts it suffers from significant tracking error however the recent move in VIX is sufficiently large that even with tracking error XIV should provide a significant return.

No new positions opened and not intending to look for new opportunities unless there is a pull back towards the recent lows.

Should I Buy Gold ?

I first looked at buying gold in 2008 when the price was 750 dollars an ounce. At the time I decided not to buy, my decision was based on conversations with the staff in a number of gold retailers. It wasn't the 5% mark up that put me off, but the reaction I got when I asked how much they would be prepared to pay to buy my gold back. Reading between the lines the message was clear "Buy it back ? Are you kidding ? If I can get rid of some of this I never ever want to see it again".

I took a rough guess that the instant I buy gold, my investment is down 5% in commission and another 10% or more in the difference between what the shop is willing to sell at and buy back at. I had no idea at the time that three years later gold would be trading at 1800 dollars an ounce, an increase of 240%.

Everyone knows the saying 'Buy low, Sell high' but its so hard to practice, it means going out on your own, buying the thing that noone wants and just as important not buying the thing that everyone does want.

If I had the stomach to stand alone and buy gold in 2008 when no one wanted it, I would now be sat on a very fat profit of over 200%.

Now that gold is at a recent record and more and more people are talking about buying gold, should I be buying, or selling ?

Gold at a recent record represented by the GLD exchange traded fund


Gold and silver are the two most commonly traded precious metals and they tend to move together rising and falling in sync with each other. Of the two metals silver is more volatile rising and falling by a greater percentage, but as the sample chart below shows there is still an obvious correlation between the two metals.

Sample period showing correlation in short term price movement of GLD and SLV Exchange traded funds tracking Gold and Silver


So with gold at record levels is silver an even better investment ? Maybe, maybe not, lets have a look at recent price action in silver and see if it can tell us anything about the future direction of gold.

One Year Price Chart - SLV Silver Exchange Traded Fund


There is an interesting phenomena around May. Beginning in February the silver price begins to increase very quickly, silver as an investment begins to appear in news stories and the volume of trades increases rapidly as shown on the bar graph at the bottom of the chart. This is a pattern which has occurred time and again in financial markets and look what happens next. The price drops.

Anyone that bought near the record price of 48.35 soon found themselves with a 28% percent loss as the price crashed from 48.35 to trade around 35 for the rest of the month. The situation has improved since, but the price still has a long way to go before getting back to the high 40s. Its also worth pointing out that anyone who bought before the exponential phase is still sitting on a very good profit.

Now lets look at a recent gold chart.

One Year Price Chart - GLD Gold Exchange Traded Fund


There are a lot of factors in common between gold today and silver in May -
1) Record Price
2) A price increasing at an exponential rate i.e. faster and faster increases
2) Increasing volume - the bar graph at the bottom shows the increasing volume in the last week
3) Gold/Silver making news headlines

I am not a great believer in the predictive ability of charts, but there are undeniable similarities between the price action before the correction in silver and the current price action in gold.

There is one final consideration which puts gold out of bounds as far as I am concerned. The gun that killed silver was a 'margin hike'.

It wasn't a single margin hike, but a series of margin hikes which made it increasingly expensive for investors to hold silver contracts, eventually most investors became forced sellers at which point - look out below.

Last week Gold margins were increased at Comex. Silver survived several margin hikes before falling almost over night to a 28 percent loss. How many more margin increases can gold take and do you want to bet your savings on it ?

Gold Falls Most In Seven Weeks as Comex Hikes Margin


Silver continues to trade in a tight range and to me represents a better option, the margin hikes have shaken out any mania that was in the price which has yet to happen with the price of gold.

There are a large number of exchange traded funds that allow you to bet on or against gold and silver prices - GLD, DZZ, SLV, AGQ, ZSL,

I currently hold a modest allocation to silver in my long term portfolio and will look to take short term trading positions using SLV or AGQ on any pull backs. The ideal entry point for me would be a dip in the silver price caused by a further increase in the gold margin. I am anticipating that to some extent both metals will sell off together even though the fundamentals for silver are not effected, I would expect silver to quickly regain any lost ground.

If and when I take a short term position in silver I will post the details.

Saturday, August 13, 2011

How To Trade Oil - USO

I have already posted why I believe trading oil is more likley to lead to profitable trades than alternatives like currencies, stocks, markets, metals etc.

See USO - Saudi's Got My Back where you may detect that I am not all that excited about using USO as the means to trade oil.

I have two charts with which I can illustrate two of the short comings of USO. This first chart is a comparison of the performance of USO against some popular oil industry ETFs that contain stocks rather than oil futures contracts.


You can see that the ETFs IEZ, OIH, XLE are more highly geared to the oil price than USO. There are lots of effects at work to create this, but one is that each company has a base cost to product oil lets say 50 dollars a barrel. If the oil price moves from 80 to 85, the value of oil after costs has gone from 30 to 35, an increase of  16%, but the price of oil itself has only increased 6.25 %. This is a massive over simplification, not all of the 16% is within the producer, it will be spread around the supply chain, but it illustrates why oil companies provide a leveraged play on the oil price.

The next chart shows the long term underperformance of USO against the same selection of oil industry ETFs. As a long term hold USO is a disaster. If you had bought any of the ETFs One year ago, you are still holding onto 20% profit, with USO you are down about 5%.


The reason for this is the way that USO is structured. It uses futures contracts to track the price of oil. The fund never takes delivery of physical oil but instead rolls the contracts. Basically this means that as the contract approaches expiry, the contract is sold and the funds are reinvested in oil further out in the future. This is an expensive strategy, there are transaction costs and time decay elements which eat away at the fund over time leading to a guaranteed under performance.

So far USO has been a disappointing trade, my entry points have well chosen given the weeks price action but the returns are minimal.

As the charts illustrating the long term underperformance of USO show, it is not a position to hold for any length of time. I will be closing this position soon out of boredom with the lack of action.

There is one glimmer of hope for this trade, if the markets blow up on Monday I will double down by selling USO and reinvesting the funds in DIG a far more exciting play on oil.

Three months price action DIG vs USO (45% top to bottom vs 22% top to bottom)


For information on all the ETFs Mentioned, link below -

IEZ, OIH, XLE, USO, DIG Detailed Summary - Yahoo Finance


Friday, August 12, 2011

The Fear Trade

This one is risky.

The markets are fearful and I am selling fear.

The link below explains the VIX, basically its a measure of how much market participants are prepared to pay for insurance against thier positions. When the markets are scared they pay more for protection. Right now there is a spike in the VIX.

VIX - The Wall Street Fear Gauge

XIV is an Exchange Traded Fund which is inverse the VIX - ie not only is it spelled the opposite way, but it also moves the opposite way. So with VIX at a peak, XIV has taken a battering, as VIX falls XIV should rise.


I took a position in XIV Wednesday, at one point it was 500 USD in the money, by the close it was out of the money for 240 USD at which point I sold not wanting to hold the position overnight.

After more research I again took a position in XIV on Thursday, this position is currently in the money for about 300 USD. I also added to the position at the open today. Right now the position is about flat.

The one thing that makes me comfortable with a large trade in XIV is that the VIX is really a measure of velocity and wherever the market eventually ends up the VIX always returns towards its mean value.

The charts above show how XIV has collapsed with the increase in volatility this week. As volatility returns to normal, XIV should almost double in value.


My two concerns with this trade are -

1) This week VIX peaked around 48, in 2008 the VIX hit 80, a surge to this level would wipe out 50% of the trade.

2) Tracking error. Its very difficult to construct a product that accurately tracks something as artificial as the 'Inverse VIX', even today VIX is down 6%, XIV has barely moved 1%.

3) Counter party risk. If this trade pays out a profit of 50% to 100%, someone somewhere is on the losing side of that. Can the loser afford to pay ? a lot of financial institutions will have been terribly beaten up this week.

Currently holding two positions, one initiated at 9.48, the second at 9.88

See the list of trades to the right for a link to XIV information.


The Big One

I have this trade I have just doubled into, its big, really big.

Its big enough get to get me going, nervous, excited, fizzing, call it what you will. The thing is in comparison to the RG56 - 'Death Warrant' trade this trade really isnt that big. Compared to the equivalent exposure of the RG56 trade this one is tiny.

One thing that this weeks sell off has taught me is to better assess risk. The total size of the RG56 trade in equivalent value was over 100K, thats just mad.

USO - Saudi's Got My Back

The only trade I consistently make money on is oil.

The gains outway the losses as there is a constant upward pressure on the price, this pressure comes in many forms -

1) Its a fundamentally dangerous business, every stage from extraction to transport, refining and distribution is dangerous, leading to short term supply disruptions and higher prices. A storm in the gulf of mexico increases the oil price, an attack on a Nigerian pipeline increases the price, routine maintenance on a Canadian pipeline can increase the price.

2) OPEC. Anyone can moan and whinge about the oil price, I don't, OPEC has my back. If the price falls too far too fast due to falling demand, OPEC will reduce supply creating artificial price pressure limiting my losses and creating a new buying opportunity.

I could go on with the reasoning, but lets get to the trade.

I usually use UK Warrants, such as RH22 Call Warrant On Brent Crude At 90

Right now I am not comfortable with the spread between Brent and WTI (West Texas Intermediate) and I see the premium at which Brent trade compressing. For this reason I am using USO to trade oil for now.

I initially took a position in USO at 34.28 intending to add if it continued to fall based on my conviction that even under a bout of selling pressure the upward bias remains.

From 34.28 the priced dropped as low as 30.48, I took advange of this to double my investment at the new price of 30.98. At this reduced price I actually bought more shares as I could afford more for the same investment amount.

The current price in pre market trade is 33.70 my break even price excluding costs is 32.56. I will be happy to exit the position at anything over 35 I would have been looking for a higher price originally, but given the size and speed of recent moves and the fact that I was able to successfully double down I am not going to be a hero on this one.

At the current pre market price profit ex costs is just shy of 400 USD, at 35 its 760.


Death Warrants

A painfully long post about a painful trade and an attempted recovery.

I could write pages and pages on warrants,what they are, how they work, why I use them, why they are stacked aginst us, why they tend to destroy wealth ! and knowing that - why do I still use them ?

For now I will just outline the current trades RG56 and RI29

RG56 is a bet on the FTSE Rising.

RI29 is a repair trade trying to recover some of the damage I took on RG56.

I bought RG56 at 28p hoping to profit from a bounce in the FTSE following its recent sharp sell off. There is a saying 'Dont try to catch a falling knife'. This was a 'Catch a falling knife' trade. The FTSE carried on selling off and I ended up bloodied as a result. Having bought in at 28 I sold the position for 17.8 for a total loss of 36%. At one point my loss was over 60%, only a trader can look at a 36% loss and consider it a comparative success.

I could have held on to the position through to today, as I type RG56 is at 23p.

RG56 September FTSE Call at 5250

Instead I took the decision to move the position expiry further out, RG56 expires on the 15/09/2011, as a warrant gets closer to its expiry so the time value component decays at an accelerating pace. By moving the position further out I am able to maintain my bet, while not suffering guaranteed losses through time decay.

To give some perspective the entire 23p value of RG56 is made up of artificial factors that will decay over the next 22 days, if the FTSE is not above 5250 on the 15th September RG56 will expire worthless.

You can see the effect of time on the warrant price using the calculator on the right of the screen in the links, RG56 loses 2% per day, RI29 loses 0.5% per day.

Back to the trade, I sold RG56 and reinvested the remaining capital in RI29, this is again a FTSE Call option with a strike price of 5250, however the expiry is three months further out at 15/12/2011 reducing the effect of time decay.

RI29 December FTSE Call at 5250

This is a flawed repair trade, my original trade in RG56 was for 20,000 units giving equivalent exposure to -

20,000*0.001*5,250 = 105,000 GBP. (Actual cost 20,000 * 28p = 5,600 GBP)

As I got beaten up on this trade I didn't want to replicate the same level of exposure in the new position so only reinvested my remaining capital allowing me to by 11,400 units of RI29 -

11,400*0.001*5,250 = 59,850 GBP. (Actual cost 11,400 * 31p =  3534 GBP)

As my equivalent exposure is roughly halved I need the market to move up twice as far to repair the damage from my original RG56 trade. I don't expect this to happen.

Although RI29 is as I type up to 33p from the 31p I bought at I am not at all commited to this trade, I will continue to evaluate this one, currently my options are -

1) Do nothing - Hope that we are just in a summer slump and that FTSE will rally back over 5,500 into the autumm.

2) Sell today - Lock in the 228 GBP profit since last night to offset against the 2,400 GBP Loss on RG56

3) Hold and 'Double Down' on any dips

My inclination is option 3) To recreate my original exposure I need to buy 8,600 more units of RI29, I would rather wait for the market to fall before doing this. If I dont get this opportunity I will default to option 1) for now.

In an ideal world I would like to skip RI29 altogether, if FTSE drops 5% to go below 5,000 I would be agressive in buying calls at a 5,000 strike.

To understand warrant pricing there used to be a very accessible online guide to published by Society Generale, when I find it I will post it, in the meantime here is this far less engaging effort from the London Stock Exchange -
London Stock Exchange Guide To Covered Warrants


Introduction

Part of the reasoning for starting this blog is to reduce the number of reckless trades I make. If I can't explain the reasoning for entering a trade here, I won't make the trade.

Since deciding to take this approach to policing my trading I have opened a number of positions which I originally published on Twitter. The twitter trades are -

XIV,RG56,RI29, I also have a position in USO which I have not previously published.

Yahoo finance - XIV
RBS Warrants UK - RG56
RBS Warrants UK - RI19
Yahoo Finance - USO